User:DuncanDaHusky/Midwest FurFest 2004 Registration Report
This page is a personal article, and may not conform to WikiFur's standards for tone or neutral writing. As a courtesy, please contact the author, DuncanDaHusky, if you wish to make major changes.
(Taken from Duncan da Husky's LiveJournal entry of December 5, 2004)
Executive Summary[edit]
In this report attendance, demographic and traffic data gathered at Midwest FurFest Registration over the past five years, the complete existence of the convention, is presented. Attendance data shows that we are continuing to maintain a healthy rate of growth (approximately 20%). Our sponsorship rate is improving as well, though not what it has been in past years. The rate of preregistered attendees is on the downward trend, something that we need to improve on if we hope to be able to provide reliable forecasts of attendees before the convention.
For the demographics data, the biggest trend was that was observed was a widening of the distribution of attendees over the United States and Canada, though attendance from outside of North America remains negligible. Traffic data shows that we continue to have an excellent throughput of attendees at peak times. It would also appear that more attendees are arriving earlier.
Attendance Data[edit]
First, the raw numbers:
|
|
2000
|
2001
|
2002
|
2003
|
2004 |
|---|---|---|---|---|---|
| Total attendees (staff excluded)
|
446
|
482
|
639
|
748
|
885 |
| Staff
|
27
|
29
|
46
|
52
|
74 |
| Total attendees (staff included)
|
473
|
511
|
685
|
800
|
959 |
| Percent increase in attendance
|
---
|
8.1%
|
32.5%
|
16.8%
|
19.9% |
| Preregistered attendees (sponsors included)
|
n/a
|
212
|
344
|
386
|
446 |
| Preregistered sponsors
|
n/a
|
51
|
69
|
64
|
66 |
| At-the-Door sponsors
|
n/a
|
34
|
26
|
19
|
24 |
| Staff sponsors
|
n/a
|
11
|
13
|
6
|
19 |
| Total sponsors
|
37
|
85
|
108
|
83
|
109 |
| % Sponsors
|
7.8%
|
16.6%
|
15.8%
|
10.4%
|
11.4% |
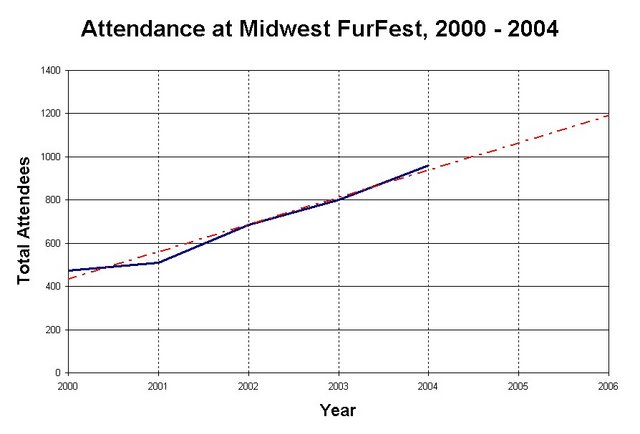
Our attendance has proven steady over the last few years, as shown below. The slight dip in 2001 is most likely due to the unfortunate events of that year. A simple linear extrapolation shows that we are on track to easily break the 1,000 attendee mark for certain next year and, if trends continue, see approximately 1,200 attendees in 2006.
As our attendance has grown, so has our staff. This is partially due to the number of people on staff growing to help serve our attendees, but it is also due in no small part to better accounting for who is on staff in the Registration Database.
2004 was a great year for sponsors, but we are still working to re-attain our previous peak sponsor rate (percentage of attendees who purchase sponsorships). This is both an important revenue source for the convention and a prime source of goodwill, since MFF tries to treat its sponsors well. I believe that as word of mouth spreads about the benefits of sponsorship spreads, we will be seeing this number increase to our previous records.

The pre-registration rate, the percentage of attendees who pre-register before the convention, has been falling over the past few years. While this is not particularly catastrophic, it is a mild annoyance for Registration when trying to forecast such things as how many Registration Bags are needed, or how many sponsorship gifts to order. In the future (i.e. 2006 and beyond) we are going to need to consider ways to improve our pre-registration rate, perhaps with sharper increases from pre-registration to at the door membership rates.
| Year
|
% Pre-Registered |
|---|---|
| 2001
|
44.0% |
| 2002
|
53.8% |
| 2003
|
51.6% |
| 2004
|
50.4% |
Demographic Data[edit]
First, the raw numbers:
|
|
2001
|
2002
|
2003
|
2004 |
|---|---|---|---|---|
| AK
|
0.0%
|
0.2%
|
0.1%
|
0.1% |
| AL
|
0.8%
|
0.6%
|
0.9%
|
0.8% |
| AR
|
2.7%
|
1.8%
|
1.1%
|
0.7% |
| AZ
|
0.0%
|
0.2%
|
0.0%
|
0.3% |
| BC
|
0.0%
|
0.0%
|
0.1%
|
0.7% |
| CA
|
2.3%
|
3.7%
|
4.9%
|
5.7% |
| CO
|
0.0%
|
0.3%
|
0.5%
|
0.6% |
| CT
|
0.6%
|
0.6%
|
1.1%
|
0.6% |
| DC
|
0.0%
|
0.2%
|
0.0%
|
0.0% |
| FL
|
1.5%
|
1.5%
|
2.1%
|
1.2% |
| GA
|
0.8%
|
0.4%
|
1.1%
|
2.1% |
| GB
|
0.0%
|
0.0%
|
0.0%
|
0.1% |
| IA
|
2.5%
|
2.0%
|
2.0%
|
2.4% |
| ID
|
0.0%
|
0.2%
|
0.0%
|
0.0% |
| IL
|
25.9%
|
25.3%
|
25.4%
|
24.2% |
| IN
|
3.9%
|
5.7%
|
4.3%
|
5.3% |
| KS
|
1.0%
|
0.6%
|
1.4%
|
1.2% |
| KY
|
1.0%
|
1.0%
|
1.3%
|
0.5% |
| MA
|
2.9%
|
0.7%
|
1.1%
|
1.0% |
| MB
|
0.0%
|
0.0%
|
0.0%
|
0.7% |
| MD
|
0.8%
|
0.9%
|
0.1%
|
1.0% |
| MI
|
9.1%
|
8.0%
|
8.0%
|
7.6% |
| MN
|
5.2%
|
4.7%
|
5.4%
|
5.0% |
| MO
|
2.9%
|
2.6%
|
3.1%
|
3.2% |
| MS
|
0.0%
|
0.3%
|
0.1%
|
0.3% |
| MT
|
0.0%
|
0.2%
|
0.0%
|
0.0% |
| MX
|
0.0%
|
0.0%
|
0.1%
|
0.0% |
| NC
|
1.2%
|
2.6%
|
1.1%
|
0.9% |
| NE
|
0.2%
|
0.6%
|
0.5%
|
0.5% |
| NH
|
0.6%
|
0.4%
|
0.4%
|
0.6% |
| NJ
|
0.6%
|
1.5%
|
1.1%
|
0.8% |
| NM
|
0.0%
|
0.4%
|
0.1%
|
0.2% |
| NS
|
0.0%
|
0.0%
|
0.0%
|
0.1% |
| NV
|
0.6%
|
0.4%
|
0.1%
|
0.1% |
| NY
|
2.9%
|
2.8%
|
3.0%
|
3.2% |
| OH
|
7.5%
|
6.1%
|
6.8%
|
5.2% |
| OK
|
0.2%
|
0.2%
|
0.4%
|
0.1% |
| ON
|
2.5%
|
3.1%
|
3.5%
|
4.2% |
| OR
|
0.0%
|
0.2%
|
0.3%
|
0.1% |
| PA
|
1.5%
|
2.2%
|
2.5%
|
1.8% |
| PQ
|
0.0%
|
0.4%
|
0.3%
|
0.7% |
| SC
|
0.0%
|
0.0%
|
0.1%
|
0.0% |
| SK
|
0.0%
|
0.0%
|
0.1%
|
0.0% |
| SU
|
0.0%
|
0.0%
|
0.0%
|
0.1% |
| TN
|
1.9%
|
1.6%
|
1.4%
|
1.2% |
| TX
|
1.2%
|
2.0%
|
1.1%
|
1.5% |
| UT
|
0.0%
|
0.2%
|
0.4%
|
0.5% |
| VA
|
2.1%
|
1.6%
|
1.0%
|
1.7% |
| VT
|
0.0%
|
0.0%
|
0.0%
|
0.1% |
| WA
|
0.6%
|
0.4%
|
0.3%
|
1.0% |
| WI
|
10.8%
|
11.5%
|
10.8%
|
10.0% |
| WV
|
0.2%
|
0.3%
|
0.3%
|
0.1% |
| WY
|
0.0%
|
0.0%
|
0.1%
|
0.1% |
Note that the data above reflects two attendees from outside of North America, one from Sweden (SU) and one from the United Kingdom (UK).
This data can be summarized by region as follows:
|
|
2000
|
2001
|
2002
|
2003
|
2004
|
|
|---|---|---|---|---|---|---|
| Midwest
|
65.9%
|
69.8%
|
66.0%
|
65.7%
|
62.8%
|
(IL, WI, IN, MI, MN, OH, MO, IA) |
| Northeast
|
5.8%
|
7.5%
|
4.5%
|
5.6%
|
5.4%
|
(NH, VT, MA, NY, CT, RI) |
| Mid-Atlantic
|
4.7%
|
4.6%
|
5.0%
|
3.9%
|
4.6%
|
(PA, MD, VA, WV) |
| South
|
n/a
|
12.4%
|
12.4%
|
11.3%
|
9.3%
|
(NC, SC, GA, FL, AL, TN, KY, AL, MS, LA, AR, TX) |
|
|
|
|
|
|
|
|
| Canada
|
n/a
|
2.50%
|
3.51%
|
4.01%
|
6.20%
|
(All Provinces) |
| West Coast
|
7.4%
|
2.9%
|
4.2%
|
5.4%
|
6.8%
|
(CA, OR, WA) |
| East Coast
|
14.6%
|
16.4%
|
13.7%
|
13.8%
|
14.3%
|
(ME, NH, VT, MA, RI, CT, NY, PA, DE, MD, VA, NC, SC, GA, FL) |
|
|
|
|
|
|
|
While our attendees are still coming from all over, a couple of things are interesting to note: 1.) A drop in attendance from the South. This is possibly due to fewer fans to pull from in that region, or fewer fans willing to travel. Also, there's a possibility that their convention needs are being served by smaller regional conventions like Furry Weekend Atlanta, Pawpet Megaplex, Rocket City Furmeet, and Texas Furry Con. 2.) A surprising rise in attendance from Canada. This could be due to having a Canadian Guest of Honor, or good word of mouth among the fans there. 3.) The falling percentage of attendees from the Midwest. I'm certain this is due less to a lower turnout from the Midwest and more to an influx of attendees from other areas of North America.
The one thing that is dramatically apparent, though, is that Midwest FurFest is slowly moving beyond being a regional convention and more of a national convention. This is best shown by charting the broad distribution of U.S. attendees:

Traffic Data[edit]
Starting last year we began time-stamping every record from the Registration Database as it was printed. This allows us to examine the flow of traffic through Registration over the course of the weekend, which in turn leads to better prediction of what staffing levels will be necessary when and where improvements to the Registration processes can be made. An hourly traffic analysis shows graphically the huge crush of attendees who register in the opening hours of the convention:
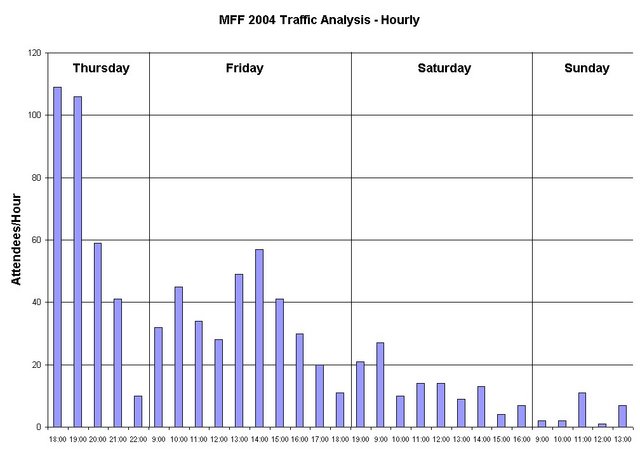
As you can see, the first few hours of Thursday night are the peak processing times, and at our maximum we were printing one badge every 19.4 seconds, a very slight improvement on last year's top speed of one badge every 20.7 seconds. This is not too surprising since we had roughly the same number of terminals available last year and this year, though the slight improvement may be that we abandoned using the older, slower client laptops (nothing faster than a Pentium 166) in favor of laptops donated by Registration staff (to whom I am eternally grateful!).
Unfortunately (and this isn't reflected in the data) while we doubled the number of printers we were using from 1 to 2, the printers were still the choke point in the Registration process. Analysis and testing of all available printers will be necessary over the next year to see if there is a way to speed this part of the process along.
Finally, if the traffic data is reduced to percentages for easier comparison between last year and this year, one inescapable conclusion can be drawn, and this was observed anecdotally by many as well: More attendees are arriving earlier.

The ramifications of this still need to be considered, but the possibility of offering more for attendees to do or have better organized events on Thursday night will definitely need to be considered.